

Third production forecast for summer crops (2026) and intentions to plant winter cereals (2026)
Derde produksieskatting vir somergewasse (2026) en voorneme om wintergewasse te plant (2026)
Summer crops / Somergewasse
- Summer crops / Somergewasse
- Graph: Total maize / Grafiek: Totale mielies
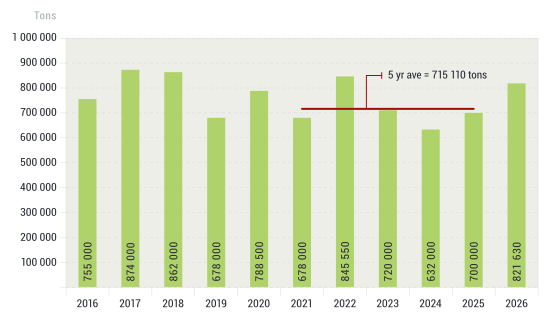
- Graph: Sunflower seed / Grafiek: Sonneblomsaad
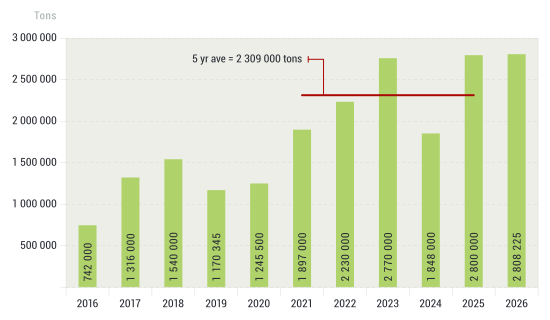
- Graph: Soybeans / Grafiek: Sojabone
- White and yellow maize / Wit- en geelmielies
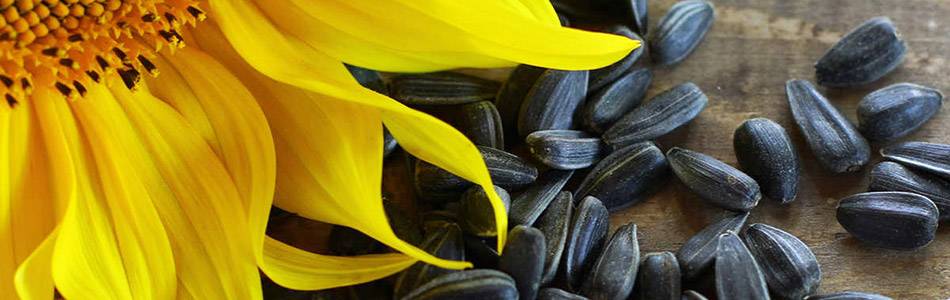
- Sunflower seed / Sonneblomsaad
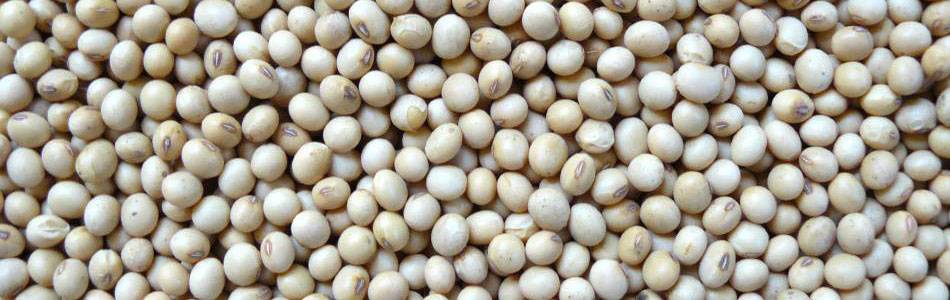
- Soybeans / Sojabone
- Groundnuts / Grondbone
- Dry beans / Droëbone
- Sorghum
- Notes / Aantekeninge
Winter cereals / Wintergewasse
- Winter Cereals / Wintergewasse
- Wheat / Koring
- Graph: Wheat / Grafiek: Koring
- Graph: Barley / Grafiek: Gars
- Graph / Grafiek: Canola
- Notes / Aantekeninge

Estimates courtecy of the Crop Estimates Committee
Syfers deur die Oesskattingskomitee verskaf
| Crop / Gewas | Area planted Oppervlakte beplant |
Third forecast Derde skatting |
Second forecast Tweede skatting |
Area planted Oppervlakte beplant |
Final crop Finale oes |
Change Verandering |
|---|---|---|---|---|---|---|
| 2026 | 2026 | 2026 | 2025 | 2025 | ||
| Ha | Tons | Tons | Ha | Tons | % | |
| (A) | (B) | (C) | (D) | (E) | (B) ÷ (C) | |
| Commercial / Kommersieël | ||||||
| White maize / Witmielies | 1 664 700 | 9 084 650 | 8 757 850 | 1 599 700 | 8 450 000 | 3.73 |
| Yellow maize / Geelmielies | 1 051 500 | 7 750 450 | 7 750 450 | 997 000 | 8 200 000 | 0.00 |
| Total Maize / Totale Mielies | 2 716 200 | 16 835 100 | 16 508 300 | 2 596 700 | 16 650 000 | 1.98 |
| Sunflower seed / Sonneblomsaad | 570 100 | 821 630 | 778 155 | 555 700 | 700 000 | 5.59 |
| Soybeans / Sojabone | 1 212 700 | 2 808 225 | 2 729 275 | 1 151 000 | 2 800 000 | 2.89 |
| Groundnuts / Grondbone | 44 650 | 69 360 | 69 360 | 48 125 | 63 350 | 0.00 |
| Sorghum | 45 000 | 140 653 | 140 653 | 41 150 | 150 000 | 0.00 |
| Dry beans / Droëbone | 38 920 | 79 450 | 80 704 | 45 620 | 90 556 | -1.55 |
| Total / Totaal | 4 627 570 | 20 754 418 | 20 306 447 | 4 438 295 | 20 453 906 | 2.21 |
| Non-commercial Maize / Nie-kommersiële Mielies | ||||||
| Total maize / Totaal mielies | 397 170 | 695 025 | N/A | 358 000 | 621 500 | N/A |
| Maize / Mielies: Commercial / Kommersieël + Non-commercial / Nie-kommersieël | ||||||
| Total maize RSA / Totaal mielies RSA | 3 113 370 | 17 530 125 | N/A | 2 954 700 | 17 271 500 | N/A |
Notes/Notas:
Estimate is for calendar year, for example production season 2025/2026 = 2026
Estimate reflects current conditions to date, assuming the remainder of the season progresses normally.
Skatting is vir kalenderjaar, byvoorbeeld produksie-seisoen 2025/2026 = 2026
Skatting weerspieël die huidige toestande tot op hede, met die aanname dat die res van die seisoen normaal sal verloop.
Production 2016-2026 Produksie

Production 2016-2026 Produksie
Production 2016-2026 Produksie
| Area planted Oppervlakte beplant |
Third forecast Derde skatting |
Area planted Oppervlakte beplant |
Final crop Finale oes |
||||||||
|---|---|---|---|---|---|---|---|---|---|---|---|
| 2026 | 2026 | 2025 | 2025 | ||||||||
| White Wit |
Yellow Geel |
Total Totaal |
White Wit |
Yellow Geel |
Total Totaal |
White Wit |
Yellow Geel |
Total Totaal |
White Wit |
Yellow Geel |
Total Totaal |
| Ha | Tons | Ha | Tons | ||||||||
| Western Cape / Wes-Kaap | |||||||||||
| 200 | 4 000 | 4 200 | 1 800 | 38 000 | 39 800 | 200 | 3 500 | 3 700 | 1 800 | 33 850 | 35 650 |
| Northern Cape / Noord-Kaap | |||||||||||
| 3 000 | 42 500 | 45 500 | 40 500 | 658 750 | 699 250 | 1 500 | 42 000 | 43 500 | 18 750 | 680 400 | 699 150 |
| Free State / Vrystaat | |||||||||||
| 840 000 | 370 000 | 1 210 000 | 4 662 000 | 2 368 000 | 7 030 000 | 850 000 | 345 000 | 1 195 000 | 4 335 000 | 2 535 900 | 6 870 900 |
| Eastern Cape / Oos-Kaap | |||||||||||
| 6 000 | 30 000 | 36 000 | 43 200 | 270 000 | 313 200 | 6 000 | 28 000 | 34 000 | 42 600 | 238 000 | 280 600 |
| KwaZulu-Natal | |||||||||||
| 47 000 | 72 000 | 119 000 | 291 400 | 633 600 | 925 000 | 50 000 | 66 000 | 116 000 | 320 000 | 617 100 | 937 100 |
| Mpumalanga | |||||||||||
| 172 000 | 368 000 | 540 000 | 1 032 000 | 2 649 600 | 3 681 600 | 162 000 | 362 000 | 524 000 | 1 093 500 | 2 986 500 | 4 080 000 |
| Limpopo | |||||||||||
| 16 000 | 20 000 | 36 000 | 108 800 | 170 000 | 278 800 | 10 000 | 18 500 | 28 500 | 71 000 | 162 800 | 233 800 |
| Gauteng | |||||||||||
| 60 500 | 65 000 | 125 500 | 356 950 | 474 500 | 831 450 | 55 000 | 57 000 | 112 000 | 360 250 | 461 700 | 821 950 |
| North West / Noordwes | |||||||||||
| 520 000 | 80 000 | 600 000 | 2 548 000 | 488 000 | 3 036 000 | 465 000 | 75 000 | 540 000 | 2 207 100 | 483 750 | 2 690 850 |
| Total / Totaal | |||||||||||
| 1 664 700 | 1 051 500 | 2 716 200 | 9 084 650 | 7 750 450 | 16 835 100 | 1 599 700 | 997 000 | 2 596 700 | 8 450 000 | 8 200 000 | 16 650 000 |
| Province / Provinsie | Area planted Oppervlakte beplant |
Third forecast Derde skatting |
Area planted Oppervlakte beplant |
Final crop Finale oes |
|---|---|---|---|---|
| Ha | Tons | Ha | Tons | |
| 2026 | 2026 | 2025 | 2025 | |
| Western Cape / Wes-Kaap | 0 | 0 | 0 | 0 |
| Northern Cape / Noord-Kaap | 500 | 1 150 | 1 000 | 2 300 |
| Free State / Vrystaat | 309 000 | 478 950 | 264 500 | 375 225 |
| Eastern Cape / Oos-Kaap | 500 | 1 000 | 700 | 1 400 |
| KwaZulu-Natal | 1 500 | 3 000 | 1 000 | 2 000 |
| Mpumalanga | 6 000 | 9 000 | 2 500 | 3 625 |
| Limpopo | 96 500 | 86 850 | 90 000 | 90 000 |
| Gauteng | 1 100 | 1 430 | 1 000 | 1 200 |
| North West / Noordwes | 155 000 | 240 250 | 195 000 | 224 250 |
| Total / Totaal | 570 100 | 821 630 | 555 700 | 700 000 |
| Province / Provinsie | Area planted Oppervlakte beplant |
Third forecast Derde skatting |
Area planted Oppervlakte beplant |
Final crop Finale oes |
|---|---|---|---|---|
| Ha | Tons | Ha | Tons | |
| 2026 | 2026 | 2025 | 2025 | |
| Western Cape / Wes-Kaap | 200 | 700 | 0 | 0 |
| Northern Cape / Noord-Kaap | 2 000 | 7 000 | 2 000 | 7 500 |
| Free State / Vrystaat | 607 000 | 1 365 750 | 565 000 | 1 300 000 |
| Eastern Cape / Oos-Kaap | 7 500 | 25 500 | 5 500 | 16 225 |
| KwaZulu-Natal | 44 000 | 178 200 | 47 000 | 190 350 |
| Mpumalanga | 314 500 | 613 275 | 315 000 | 771 750 |
| Limpopo | 17 500 | 63 000 | 16 500 | 51 975 |
| Gauteng | 55 000 | 126 500 | 52 000 | 114 400 |
| North West / Noordwes | 165 000 | 429 000 | 148 000 | 347 800 |
| Total / Totaal | 1 212 700 | 2 808 925 | 1 151 000 | 2 800 000 |
| Province / Provinsie | Area planted Oppervlakte beplant |
Third forecast Derde skatting |
Area planted Oppervlakte beplant |
Final crop Finale oes |
|---|---|---|---|---|
| Ha | Tons | Ha | Tons | |
| 2026 | 2026 | 2025 | 2025 | |
| Western Cape / Wes-Kaap | 0 | 0 | 0 | 0 |
| Northern Cape / Noord-Kaap | 2 550 | 7 522 | 3 100 | 8 525 |
| Free State / Vrystaat | 16 750 | 27 638 | 21 700 | 29 280 |
| Eastern Cape / Oos-Kaap | 0 | 0 | 0 | 0 |
| KwaZulu-Natal | 200 | 510 | 175 | 175 |
| Mpumalanga | 0 | 0 | 0 | 0 |
| Limpopo | 2 650 | 5 565 | 1 650 | 2 970 |
| Gauteng | 0 | 0 | 0 | 0 |
| North West / Noordwes | 22 500 | 28 125 | 21 500 | 22 400 |
| Total / Totaal | 44 650 | 69 360 | 48 125 | 63 350 |
| Province / Provinsie | Area planted Oppervlakte beplant |
Third forecast Derde skatting |
Area planted Oppervlakte beplant |
Final crop Finale oes |
|---|---|---|---|---|
| Ha | Tons | Ha | Tons | |
| 2026 | 2026 | 2025 | 2025 | |
| Western Cape / Wes-Kaap | 100 | 200 | 100 | 200 |
| Northern Cape / Noord-Kaap | 1 000 | 2 600 | 950 | 2 280 |
| Free State / Vrystaat | 9 500 | 14 250 | 17 500 | 28 875 |
| Eastern Cape / Oos-Kaap | 170 | 340 | 200 | 400 |
| KwaZulu-Natal | 1 250 | 1 875 | 3 000 | 5 100 |
| Mpumalanga | 1 900 | 3 040 | 2 320 | 4 176 |
| Limpopo | 17 700 | 44 250 | 11 100 | 30 525 |
| Gauteng | 800 | 1 520 | 950 | 1 900 |
| North West / Noordwes | 6 500 | 11 375 | 9 500 | 17 100 |
| Total / Totaal | 38 920 | 79 450 | 45 620 | 90 556 |
| Province / Provinsie | Area planted Oppervlakte beplant |
Third forecast Derde skatting |
Area planted Oppervlakte beplant |
Final crop Finale oes |
|---|---|---|---|---|
| Ha | Tons | Ha | Tons | |
| 2026 | 2026 | 2025 | 2025 | |
| Western Cape / Wes-Kaap | 0 | 0 | 0 | 0 |
| Northern Cape / Noord-Kaap | 0 | 0 | 0 | 0 |
| Free State / Vrystaat | 10 500 | 32 550 | 12 800 | 46 755 |
| Eastern Cape / Oos-Kaap | 100 | 300 | 200 | 600 |
| KwaZulu-Natal | 100 | 350 | 100 | 380 |
| Mpumalanga | 7 400 | 38 480 | 9 200 | 45 080 |
| Limpopo | 21 000 | 50 400 | 13 000 | 37 700 |
| Gauteng | 550 | 2 255 | 850 | 3 485 |
| North West / Noordwes | 5 350 | 16 318 | 5 000 | 16 000 |
| Total / Totaal | 45 000 | 140 653 | 41 150 | 150 000 |
Summer crops / Somergewasse
Area estimate and third production forecast (2026) Oppervlakte- en derde produksieskatting
Summer field crops – 2026
Commercial maize
The size of the expected commercial maize crop has been set at 16,835 million tons, which is 1,98% or 326 800 tons more than the previous forecast of 16,508 million tons. This is the largest maize crop on record. The area estimate for total maize is 2,716 million ha while the expected yield is 6,20 t/ha.
The estimated maize crop is 1,11% or 185 100 tons more than the 2025 crop. The three main maize producing areas, namely the Free State, Mpumalanga and North West provinces are expected to produce 82% of the 2026 crop.
The production forecast of white maize is 9,085 million tons, which is 3,73% or 326 800 tons more than the 8,758 million tons of the previous forecast. The area estimate for white maize is 1,665 million ha with an expected yield of 5,46 t/ha.
In the case of yellow maize, he production forecast remained unchanged at 7,750 million tons. The area estimate for yellow maize is 1,052 million ha with an expected yield of 7,37 t/ha.
The yield per ha for the Mpumalanga province was based on scientific and objective results provided by the ARC. Please note that the objective results for the Free State and North West provinces will be available in May 2026.
Other summer crops
Sunflower seed: The production forecast for sunflower seed is 821 630 tons, which is 5,59% or 43 475 tons more than the previous forecast of 778 155 tons. The area estimate for sunflower seed is 570 100 ha, while the expected yield is 1,44 t/ha.
Other crops
The production forecast for soybeans increased by 2,92% or 79 650 tons to 2,809 million tons. This is the largest soybean crop on record. The estimated area planted to soybeans is 1 212 700 ha, with an expected yield of 2,32 t/ha.
The expected groundnut crop remained unchanged at 69 360 tons. For groundnuts, the area estimate is 44 650 ha, with an expected yield of 1,55 t/ha.
The production forecast for sorghum also remained unchanged at 140 653 tons. The area estimate for sorghum is 45 000 ha and the expected yield is 3,13 t/ha.
In the case of dry beans, the production forecast is 79 450 tons, which is 1,55% or 1 254 tons less than the previous forecast. The area estimate of dry beans was adjusted downwards by 4,96% or 2 030 ha, from 40 950 ha to 38 920 ha. The expected yield is 2,04 t/ha.
Please note that the fourth production forecast for summer field crops for 2026 will be released on 26 May 2026.
Information is available online at the Department of Agriculture, Land Reform and Rural Development or SAGIS, as from 14:30 on the date of the relevant meeting of the Crop Estimates Committee.
Somergewasse – 2026
Kommersiële mielies
Die grootte van die verwagte kommersiële mielie-oes is op 16,835 miljoen ton gestel, wat 1,98% of 326 800 ton meer is as die vorige skatting van 16,508 miljoen ton. Dit is die grootste mielie-oes op rekord. Die oppervlakteskatting vir totale mielies is 2,716 miljoen ha terwyl die verwagte opbrengs 6,20 t/ha is.
Die geskatte mielie-oes is 1,11% of 185 100 ton meer as die 2025-oes. Die drie belangrikste mielieproduserende gebiede, nl. die Vrystaat, Mpumalanga en Noordwes provinsies, gaan na verwagting 82% van die 2026-oes produseer.
Die produksieskatting van witmielies is 9,085 miljoen ton, wat 3,73% of 326 800 ton meer is as die 8,758 miljoen ton van die vorige skatting. Die oppervlakteskatting vir witmielies is 1,665 miljoen ha en die verwagte opbrengs is 5,46 t/ha.
In die geval van geelmielies is die produksieskatting onveranderd gelaat op 7,750 miljoen ton. Die oppervlakteskatting vir geelmielies is 1,052 miljoen ha en die verwagte opbrengs is 7,37 t/ha.
Die opbrengs-bepaling per ha vir die Mpumalanga provinsie is gebaseer op wetenskaplike en objektiewe resultate verstrek deur die LNR. Neem kennis dat die objektiewe resultate vir die Vrystaat en Noordwes provinsies, in Mei 2026 gerapporteer sal word.
Ander somergewasse
Sonneblomsaad: Die produksieskatting vir sonneblomsaad is 821 630 ton, wat 5,59% of 43 475 ton meer is as die vorige skatting van 778 155 ton. Die oppervlakteskatting vir sonneblomsaad is 570 100 ha, terwyl die verwagte opbrengs 1,44 t/ha is.
Ander gewasse
Die produksieskatting van sojabone is vermeerder met 2,92% of 79 650 ton na 2,809 miljoen ton. Hierdie is die grootste sojaboon-oes op rekord. Die geskatte oppervlakte beplant van sojabone is 1 212 700 ha, met 'n verwagte opbrengs van 2,32 t/ha.
Die verwagte grondbone-oes is onveranderd gelaat op 69 360 ton gestel. Vir grondbone is die oppervlakteskatting 44 650 ha, terwyl the verwagte opbrengs 1,55 t/ha is.
Die produksieskatting van sorghum is ook onveranderd gelaat op 140 653 ton. Die oppervlakteskatting vir sorghum is 45 000 ha, en die verwagte opbrengs is 3,13 t/ha.
In die geval van droëbone is die produksieskatting 79 450 ton, wat 1,55% of 1 254 ton minder is as die vorige skattting. Die oppervlakte beplant met droëbone is afwaarts aangepas met 4,96% of 2 030 ha vanaf 40 950 ha na 38 920 ha. Die verwagte opbrengs is 2,04 t/ha.
Neem asseblief kennis dat die vierde produksieskatting vir somergewasse vir 2026, op 26 Mei 2026 vrygestel sal word.
Inligting is beskikbaar aanlyn by die Department of Agriculture, Land Reform and Rural Development of by SAGIS, vanaf 14:30 op die dag van die toepaslike vergadering van die Oesskattingskomitee.
| Crop / Gewas | Intentions * Voorneme * |
Area planted Oppervlakte beplant |
Final estimate Finale skatting |
Change / Verandering |
|---|---|---|---|---|
| 2026 | 2025 | 2025 as on 26 Feb 2026/ soos op 26 Feb 2026 |
||
| Ha | Ha | Tons | % | |
| (A) | (B) | (C) | (A) ÷ (B) | |
| Commercial / Kommersieël | ||||
| Wheat / Koring | 486 400 | 517 300 | 1 897 220 | -5.97 |
| Malting barley / Moutgars | 101 900 | 96 950 | 346 430 | 5.11 |
| Canola | 189 175 | 174 515 | 309 035 | 8.40 |
| Cereal oats / Hawermout | 39 000 | 35 520 | 45 143 | 9.80 |
| Sweet lupins / Soetlupine | 21 000 | 21 000 | 17 850 | 0.00 |
| Total winter cereals / Totaal wintergewasse | 837 475 | 845 285 | 2 615 678 | -0.92 |
* Based on conditions at the middle of April 2026 / Gebaseer op toestande soos teen middel April 2026.
| Province / Provinsie | Intentions Voorneme |
Area planted Oppervlakte beplant |
Final estimate Finale skatting |
|---|---|---|---|
| 2026 | 2025 | 2025 | |
| Ha | Ha | Tons | |
| Western Cape / Wes-Kaap | 335 000 | 363 000 | 980 100 |
| Northern Cape / Noord-Kaap | 41 000 | 40 000 | 300 000 |
| Free State / Vrystaat | 55 000 | 57 000 | 265 050 |
| Eastern Cape / Oos-Kaap | 5 500 | 5 500 | 37 400 |
| KwaZulu-Natal | 8 000 | 8 500 | 51 000 |
| Mpumalanga | 3 000 | 3 500 | 22 400 |
| Limpopo | 28 000 | 28 000 | 165 200 |
| Gauteng | 900 | 800 | 5 120 |
| North West / Noordwes | 10 000 | 11 000 | 70 950 |
| Total / Totaal | 486 400 | 517 300 | 1 897 220 |
Area planted 2010-2026 Oppervlakte beplant
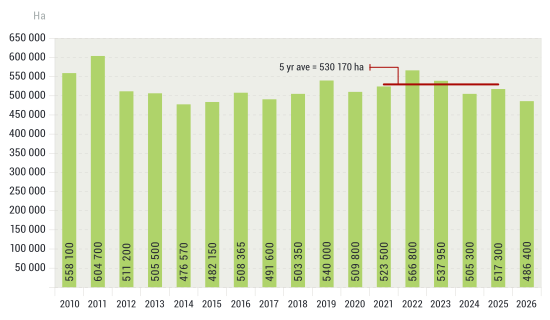
Area planted 2010-2026 Oppervlakte beplant
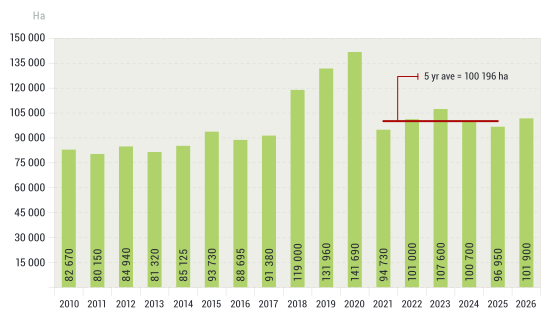
Area planted 2010-2026 Oppervlakte beplant

Winter cereal crops / Wintergewasse
Intentions to plant for 2026 / Voorneme om te plant vir 2026
Winter cereal crops – 2026
Producers' intentions to plant winter cereals are mainly based on the results of a non-probability survey conducted by the Directorate: Statistics and Economic Analysis of the Department of Agriculture and reflects the position as at the middle of April 2026. Inputs were also received from the representatives of the respective Provincial Departments of Agriculture.
The figures for wheat represent the total number of hectares that are intended to be planted for grain, excluding any hectares that will be planted for fodder and grazing.
Early indications are that producers intend to plant 486 400 ha of wheat for the 2026 production season. This is 5,97% or 30 900 ha less than the 517 300 ha planted to wheat in 2025.
The main producing areas are within the Western Cape with 335 000 ha (69%), followed by the Free State with 55 000 ha (11%) and the Northern Cape with 41 000 ha (8%).
The expected area planted to malting barley is 101 900 ha, which is 5,11% or 4 950 ha more than the 96 950 ha of the previous year. The expected area planted to canola is 189 175 ha, which is 8,40% or 14 660 ha more than the 174 515 ha planted in 2025. Producers intend to plant 39 000 ha of cereal oats, which is 9,80% or 3 480 ha more than the 35 520 ha of the previous season. The expected area planted to sweet lupines is 21 000 ha – the same as the previous season.
Please note that the preliminary area estimate of winter crops for 2026 will be released on 28 July 2026.
Information is available online at the Department of Agriculture, Land Reform and Rural Development or SAGIS, as from 14:30 on the date of the relevant meeting of the Crop Estimates Committee.
Wintergewasse – 2026
Produsente se voorneme om wintergewasse te plant is hoofsaaklik gebaseer op die resultate van 'n nie-ewekansige opname onderneem deur die Direktoraat: Statistiek en Ekonomiese Analise van die Departement van Landbou en weerspieël die situasie teen die middel van April 2026. Insette is ook ontvang vanaf die verteenwoordigers van die onderskeie Provinsiale Departemente van Landbou.
Die syfers vir koring verteenwoordig die totale aantal hektare wat werklik beplant gaan word vir graan, uitgesluit alle hektare wat beplant gaan word vir groenvoer en weiding.
Vroeë aanduidings is dat produsente van voorneme is om 486 400 ha koring te plant vir die 2026-produksie-seisoen. Dit is 5,97% of 30 900 ha minder koring aangeplant as die 517 300 ha in 2025.
Die grootste produserende gebiede is in die Wes-Kaap, met 335 000 ha (69%), gevolg deur die Vrystaat met 55 000 ha (11%) en die Noord-Kaap met 41 000 ha (8%).
Die verwagte aanplantings van moutgars is 101 900 ha – 5,11% of 4 950 ha meer as die 96 950 ha van die vorige jaar. Die verwagte aanplantings van canola is 189 175 ha, wat 8,40% of 14 660 ha meer is as die 174 515 ha wat aangeplant was in 2025. Produsente is van voorneme om 39 000 ha hawermout te plant, wat 9,80% of 3 480 ha meer is as die 35 520 ha van die vorige seisoen. Die verwagte aanplantings van soetlupine is 21 000 ha – dieselfde as die vorige seisoen.
Neem asseblief kennis dat die voorlopige oppervlakteskatting vir wintergewasse vir 2026 op 28 Julie 2026 vrygestel sal word.
Inligting is beskikbaar aanlyn by die Department of Agriculture, Land Reform and Rural Development of by SAGIS, vanaf 14:30 op die dag van die toepaslike vergadering van die Oesskattingskomitee.
CONFIDENTIALITY ISSUES that CEC members are committed to adhere to on the day of the meeting
- Personal items such as laptops, handbags, cell phones, etc. are not allowed in the venue during the meeting.
- The embargo time for the release of crop estimates information is 15:30.
- No member is allowed to discuss crop estimates information with anyone other than a member of the Committee before the embargo time.
- Only the Chairperson, or a member appointed by the Chairperson, may release the figures to the media.
- Members must regard the detail of any information that was collected for and/or discussed during the meeting, as confidential.
- Individual information received for crop estimate purposes is treated strictly confidential, and is not divulged for any other purposes.